Playbook
Why Your Insurance Agency's Cost Per Lead Keeps Climbing
Google and Facebook charge you the moment someone clicks. What happens on your landing page in the next few seconds decides how much that lead actually cost.


20 min read
Google Ads charges Finance and Insurance advertisers $74.44 a lead on average, drawn from 13,474 US search campaigns run between April 2025 and March 20261. That price is set before your landing page ever loads. A slow page does not refund the click, it just converts fewer of the clicks you already paid for, which raises your real cost per lead without your cost per click ever changing. Google's own case studies show Core Web Vitals fixes lifting conversion rate anywhere from 8.9% to 33.13% depending on the site6,7.
The charge that already happened
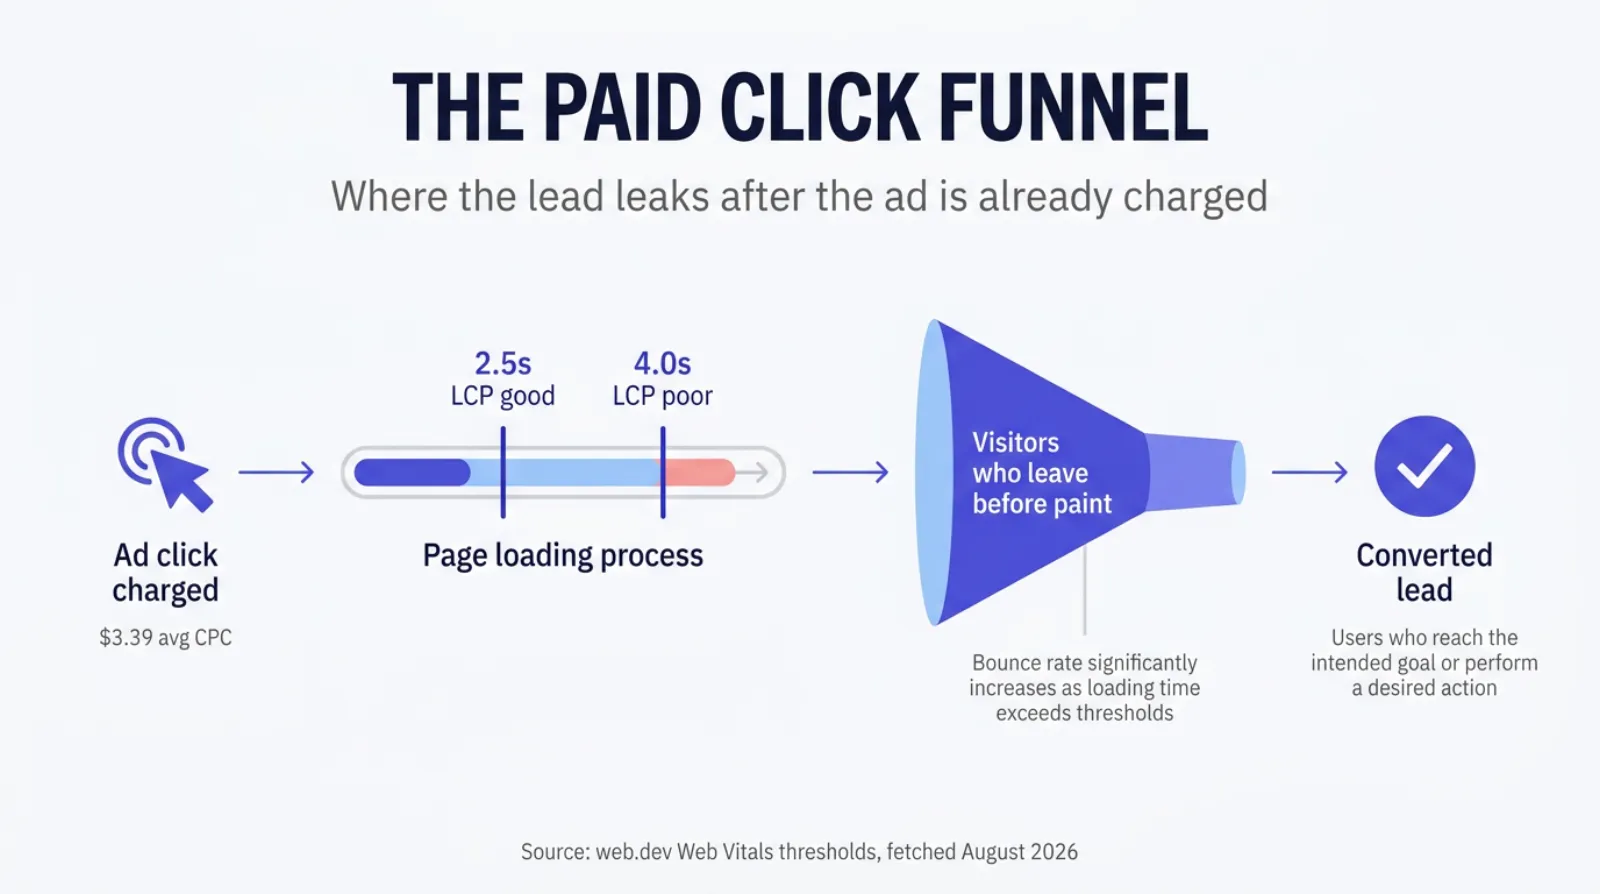
Here is the part of the funnel most agencies never look at directly. The moment someone clicks your Google or Facebook ad, you have already been charged. Not when they fill out the form. Not when they call. The click itself is the transaction, and it happens whether the person who clicked sees your offer in half a second or gives up and closes the tab in six.
That ordering matters more than it sounds like it should, because it means your landing page is not really a sales page anymore once someone has clicked a paid ad to get there. It is closer to a receipt. The money is spent. The only open question left is whether the page turns that spent dollar into a lead or lets it evaporate on a slow load nobody budgeted for.
Most agencies track cost per click and cost per lead as if they are two separate numbers set by the ad platform. They are not fully separate. Cost per click is set at auction, largely out of your hands. Cost per lead is cost per click divided by how many of those paid clicks actually convert, and that second number is decided almost entirely by what happens on your own site in the seconds after the click lands, not by anything Google or Meta controls.
It is worth being specific about who this guide is for. If you are not running paid search or paid social for your agency at all, the speed argument still applies to organic traffic, but the math in this guide, the one built entirely around a cost you are already paying per click, will not land the same way. This is written for an agency that has a live Google Ads or Meta campaign right now, checks its cost per lead at least monthly, and has never actually run its own landing page through Google's PageSpeed Insights tool to see what a paid visitor's phone is doing in the two or three seconds after the click.
The distinction this guide is built on
Cost per click is a bidding outcome. Cost per lead is a bidding outcome divided by a conversion rate, and conversion rate is the one variable in that equation your landing page actually controls. Everything below follows from that one line.
What a lead costs an insurance agency right now
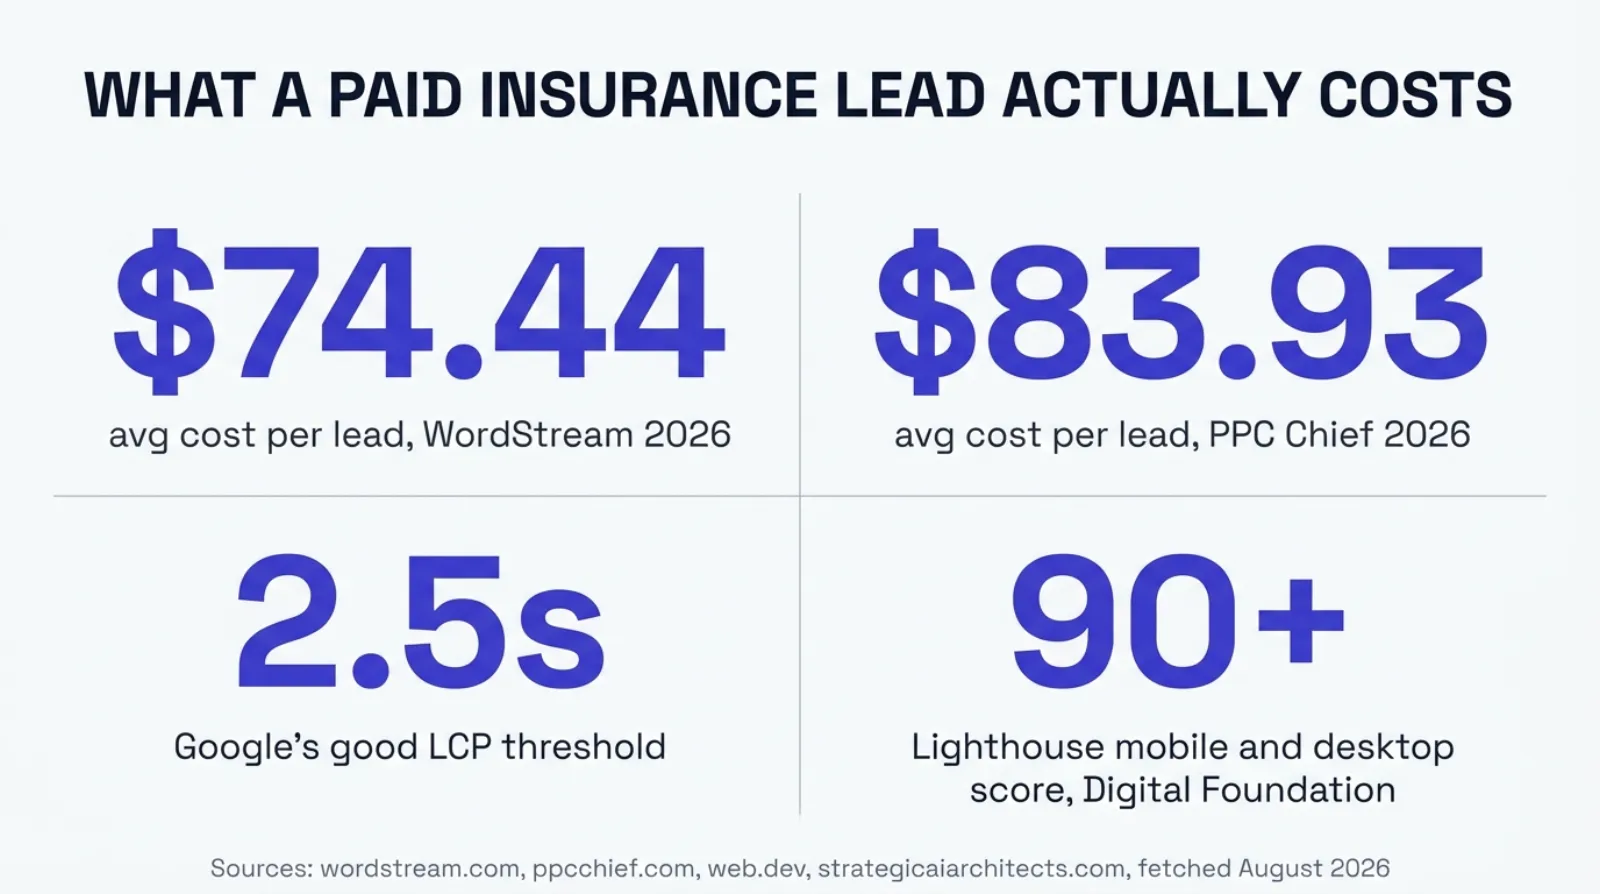
WordStream's 2026 Google Ads benchmark report puts the Finance and Insurance category at $3.39 per click and $74.44 per lead, drawn from 13,474 US search campaigns run between April 1, 2025 and March 31, 20261. The category also carries a 9.83% click-through rate, the second highest of the 23 industries WordStream measured, against a comparatively low 2.64% conversion rate, which is exactly the combination that produces a high cost per lead even when the cost per click looks reasonable1. PPC Chief, drawing on its own managed account data alongside third-party benchmarks, lands close by at $3.46 per click and $83.93 per lead2.
| Source | Avg. CPC | Avg. CPL | Period |
|---|---|---|---|
| WordStream | $3.39 | $74.44 | Apr 2025 to Mar 20261 |
| PPC Chief | $3.46 | $83.93 | Reviewed May 20262 |
| WordStream, all industries | — | $66.69 | Apr 2025 to Mar 20261 |
Two independent benchmarks landing within about $10 of each other is worth pausing on. It means $74 to $84 a lead is not a fluke of one agency's account, it is close to the going rate for the category right now. It also means the category pays more than the all-industry average of $66.691, which tracks with a category that carries real compliance weight, real underwriting behind every quote, and a buyer who is often comparison shopping three or four agencies before they ever pick up the phone.
Pull your own number before you read further
Open your Google Ads account and check your actual cost per lead against the $74.44 to $83.93 range above. If you are running well above it, the next two sections are about why, and the landing page is the first place to look, not the last.
Why a slow page taxes a paid click specifically
Organic traffic is patient in a way paid traffic is not. Someone who found you through a search result they scrolled to reach has already invested effort. Someone who clicked a paid ad has invested nothing but a tap, and a slow page gives that person permission to bail with zero sunk cost, unlike the agency, which has already paid for the click whether or not the visitor ever sees the offer.
There is a second layer that makes this worse than a simple lost visitor. Google's Quality Score, which directly sets what you pay per click at a given ad position, weighs landing page experience as one of its named components, and Google states plainly that Core Web Vitals performance "aligns with what our core ranking systems seek to reward"3. A slow landing page does not just convert worse. On Google specifically, it can also raise the price of the click itself, before conversion even enters the picture.
Meta does not publish a Quality Score by that name, but its ad delivery system estimates how likely a click is to lead to a valued action and prices delivery partly on that estimate. A landing page with a track record of visitors bouncing before it finishes loading works against that estimate the same way a bad Quality Score works against you on Google. The platforms differ in the mechanics. The direction is the same on both: a slow page makes the traffic you are already paying for more expensive to keep buying.
What Quality Score actually weighs
It helps to see the mechanism in Google's own terms rather than take it on faith. Google Ads Help names three components that make up Quality Score: expected click-through rate, ad relevance, and landing page experience, which Google defines plainly as "how relevant and useful your landing page is to people who click your ad"10.
| Component | What Google says it measures |
|---|---|
| Expected CTR | The likelihood your ad will be clicked when shown10 |
| Ad relevance | How closely your ad matches the intent behind a search10 |
| Landing page experience | How relevant and useful your landing page is to people who click your ad10 |
You can see your own rating for that third component directly inside the Google Ads interface, reported as Below Average, Average, or Above Average alongside your keywords. A page that loads slowly, buries the offer below a wall of unrelated content, or forces a mobile visitor to pinch and zoom will typically show Below Average there, and Below Average on landing page experience is the single most common reason an agency's Quality Score sits lower than its ad copy alone would predict. A low Quality Score, in turn, is what raises the price Google charges you to hold the same ad position against competitors bidding on the same keywords, which is a second, separate cost on top of the conversion loss covered above.
What Core Web Vitals actually measure
Core Web Vitals are three published metrics Google uses to describe real user experience, each measured at the 75th percentile of visits and scored separately for mobile and desktop, since the two are evaluated on different simulated hardware4. On a landing page you paid to send traffic to, each one maps to a specific moment a paid visitor either stays or leaves.
| Metric | Good | Needs improvement | Poor |
|---|---|---|---|
| LCP, Largest Contentful Paint | ≤ 2.5s | 2.5s to 4.0s | > 4.0s5 |
| INP, Interaction to Next Paint | ≤ 200ms | 200ms to 500ms | > 500ms5 |
| CLS, Cumulative Layout Shift | ≤ 0.1 | 0.1 to 0.25 | > 0.255 |
LCP is the one that matters most on a paid landing page, because it is the closest measurable proxy for "how long did the visitor stare at a blank or half-drawn screen after they clicked." Google's good threshold is 2.5 seconds or less4,5. On mobile, where most paid insurance traffic lands first, a page loaded on a page builder or a heavy WordPress theme routinely misses that mark before a single plugin or tracking script is even accounted for.
What it costs, worked in real numbers
Numbers land better with real arithmetic behind them, so here is a worked, clearly labeled scenario using only the figures verified above. It is illustrative, not a promise about your account, since your baseline conversion rate depends on your market, your keywords, and your landing page today.
Say an agency spends $3,000 a month on Google Ads in the Finance and Insurance category, at the WordStream benchmark of $74.44 per lead1. That spend buys roughly 40 leads a month. Now bring in a real, documented outcome from Google's own case studies. Nuvemshop, an e-commerce platform Google worked with directly, improved LCP health from 57% to 96% across its stores between January 2025 and January 2026 and measured an 8.9% increase in mobile, organic-search conversion rate as a result6. Applied hypothetically to the same $3,000 spend, holding clicks and cost per click constant, an 8.9% conversion lift turns 40 leads into roughly 44, which drops the effective cost per lead from $74.44 to about $68.35, same dollars spent.
Rakuten 24 measured a larger effect in an A/B test Google also published: a 33.13% increase in conversion rate tied to Core Web Vitals optimization7. Applied to the same hypothetical $3,000 spend, that scale of lift turns 40 leads into roughly 53, dropping the effective cost per lead to about $56.60.
| Scenario | Documented conversion lift | Leads at $3,000/mo | Effective CPL |
|---|---|---|---|
| Baseline, category average | — | ~40 | $74.441 |
| Nuvemshop-scale CWV fix | +8.9%6 | ~44 | ~$68.35 |
| Rakuten-scale CWV fix | +33.13%7 | ~53 | ~$56.60 |
Read that table for the shape of the effect, not as a forecast for your account. Nuvemshop and Rakuten are not insurance agencies, and no guide can promise your landing page will see either number. What the table shows honestly is that documented, Google-verified Core Web Vitals fixes have moved conversion rate anywhere from single digits to over 30% at real companies, and every point of that movement lowers your effective cost per lead at the exact spend you are already committing today.
Why a funnel builder loads slower than a coded page
This is architecture, not a configuration mistake any one agency made. A funnel platform or a WordPress page builder is software that runs in the visitor's browser to assemble your page after it arrives. It has to load a JavaScript runtime, fetch the page's content and layout data, then render the result, and every one of those steps happens between the click and the moment your landing page's headline actually appears.
A statically built page skips that assembly step entirely. Astro, the framework we build on, ships zero JavaScript to the browser by default8, meaning the server sends a finished HTML page and the browser paints it immediately, the same way it would paint a plain text file. There is no runtime to boot and no client-side assembly standing between the click and the content.
What loads before your headline appears
- A JavaScript runtime boots in the visitor's browser
- Layout and content data are fetched after that
- Theme assets, plugins, and often a chat widget load alongside
- The page assembles client-side, then finally paints
What the paid visitor seesA blank or partial screen, then the page
What loads before your headline appears
- A finished HTML document, already assembled at build time
- Zero JavaScript required to render the visible page8
- The browser paints it the way it paints plain text
- Interactive pieces load after, without blocking the paint
What the paid visitor seesThe finished page, immediately
None of this means every page-builder site is unusably slow, or that every static site is automatically fast. A poorly optimized Astro site can still ship an oversized hero image. What it does mean is that a page builder starts the race with a runtime to load before it can even begin assembling your content, while a static page starts already finished. One architecture is working against your ad spend by default. The other is not.
Insurance landing pages carry a specific version of this problem worth naming directly. A compliant page often needs a TPMO disclaimer, a government non-endorsement line, and sometimes an embedded quote widget or an e-signature form on top of the base page, and every one of those pieces is usually added as a separate script or iframe bolted onto a page builder template. Each addition is a legitimate compliance requirement on its own. Stacked together on a platform that already loads a runtime before anything renders, they compound a problem the page started with rather than creating a new one from nothing.
How to check your own landing page right now
Before anything else, find out where your own page actually stands. This takes about two minutes and does not require switching platforms.
Run PageSpeed Insights
Paste your landing page URL into Google's free tool and read the mobile score separately from desktop. They are graded on different simulated hardware, and mobile is the harder, more important score.
Find your LCP element
PageSpeed Insights names the specific element responsible for your LCP. It is almost always the hero image or headline. That is the one file or line of code worth fixing first.
Compress the hero image
A photographic PNG or an unoptimized JPG can be three to five times the file size of the same image saved as WebP. This is usually the single fastest fix available on a page-builder site.
Audit third-party scripts
Every tracking pixel, chat widget, and embedded video adds a script the browser has to fetch and run before the page settles. Remove anything not actively used.
Check for render-blocking fonts
A Google Fonts stylesheet loaded the default way blocks rendering until it downloads. Self-hosting the font file with font-display swap removes that block.
Re-test after each change
Fix one thing, re-run PageSpeed Insights, and confirm the LCP number actually moved before assuming a change helped.
Do these six things in order and most WordPress or page-builder landing pages will show a real, measurable LCP improvement within an afternoon. What they will not do is turn a page builder into a statically rendered page, because the runtime the platform loads before your content is a property of the platform itself, not a setting hidden somewhere in your dashboard. That ceiling is the honest answer to how far self-service optimization goes, and it is worth knowing before you spend a weekend chasing a score the architecture will not give you.
This genuinely helps, and it is free
You can do all six of these yourself this afternoon, and most agencies see a real LCP improvement from image compression and script cleanup alone. Where a DIY fix tends to plateau is the runtime the platform itself loads before your content, since that piece is not something a plugin or setting can remove.
Mistakes that make cost per lead look like a targeting problem
When cost per lead climbs, the instinct in most agencies is to touch the ad account first. Tighten the keyword list, exclude another geography, lower the bid. Sometimes that is the right call. Often it is treating the symptom on the platform you can see instead of the cause sitting on the page you built and mostly forgot about.
Blaming the platform first
Cutting keywords or lowering bids treats a symptom. If landing page experience is Below Average in your own Quality Score report, no amount of bid adjusting fixes the actual cause.
Testing on a desktop browser
Most paid insurance traffic lands on a phone first. A page that looks fine on a wide monitor can still miss the 2.5 second LCP threshold badly on mobile, where it is scored separately.
Adding a chat widget to fix conversion
A chat widget is a script the browser has to load. Adding one to a slow page to "help conversion" frequently makes the underlying LCP problem worse, not better.
Fixing speed once and never re-checking
A theme update, a new plugin, or a marketing team adding a tracking pixel six months later can quietly undo a speed fix. Core Web Vitals are not a one-time project.
Reading the headline score, not the LCP element
A single PageSpeed Insights score can look acceptable while the specific LCP element, usually the hero image, is still the actual bottleneck. Read the breakdown, not just the number.
Assuming a "free" platform has no speed cost
WordPress core is free software. The theme, the page builder, and the plugin stack running on top of it are not free of load time, even when they are free of a subscription fee.
What a real fix looks like
This is the one section built to describe what we do, so it stays narrow and sticks to what is on our own live pricing page. Digital Foundation replaces the funnel-builder or WordPress stack with a site built on Astro, so the architectural gap described above stops being a gap at all. Our builds score 90 or higher on Lighthouse performance for both mobile and desktop, and a number of pages score 100, the tier and pricing verified live on the Digital Foundation page this session9.
| Tier | Price | What it adds |
|---|---|---|
| Starter | $247/mo | Complete, compliant site with AEO optimization, GBP management, AI chat widget9 |
| Pro | $497/mo | Plus weekly blog post, weekly location page, 24/7 AI receptionist9 |
| Scale | $997/mo | Plus daily blog cadence, 2 new location pages weekly9 |
Every tier is month to month with a 14 day free trial and no setup fee for a limited time, with the stated guarantee reading plainly: live in days, and if you do not love it, you walk away with no fees9. If your agency's needs go beyond the three published tiers, conversational AI wired to CRM context, voice AI, or a custom quoting tool, that work is scoped on a call under AI Expert or Enterprise instead of sold as a fixed monthly line.
It is fair to ask whether this is worth doing if you are happy running your current stack and your cost per lead is manageable. For a single producer with a light ad budget and no plans to scale spend, the DIY steps covered above are a reasonable stopping point, and there is no rule that says every agency has to rebuild its site to run ads. The math in this guide matters most for an agency spending real, recurring dollars on paid traffic, where even a modest percentage move in conversion rate compounds into a meaningful monthly number, month after month, for as long as the campaign keeps running.
What changes once the leak is fixed
Strip away the platform names and the outcome this guide is actually describing is narrow and concrete. The same ad spend, the same keywords, the same offer, converts a larger share of the clicks you are already paying for, because the page those clicks land on finishes rendering before the visitor decides to leave. Nothing about your targeting, your bids, or your offer has to change for that shift to show up in your numbers.
On Google specifically, a landing page experience rating that moves from Below Average toward Above Average also improves Quality Score, which can lower what you pay per click at the same ad position, on top of the conversion gain. That is two separate levers, cost per click and conversion rate, both moving in your favor from the same fix, which is why the effective cost per lead moves faster than either number alone would suggest.
There is a compounding piece too. A faster, static site is not just better for the paid visitor arriving from a Google or Facebook ad. It is also the same technical foundation that helps an agency get found organically and cited by name in an AI-generated answer, since Google states its core ranking systems reward the same Core Web Vitals performance this guide has been walking through3. Fixing the landing page for paid traffic and building an organically discoverable, AI-citable site are not two separate projects. They are the same architecture, doing two jobs at once.
What changes if you run ads for more than one office
Everything above holds for a single-location agency running one landing page. The math compounds for an FMO or IMO running paid campaigns across several offices or several downline agents, each sending traffic to their own funnel-builder page, because a slow landing page tax applies separately to every single campaign, not once across the whole organization.
If five offices are each spending $3,000 a month at the $74.44 category CPL, that is $15,000 a month in ad spend total, and the same 8.9% to 33.13% documented conversion range applies to each office's spend independently6,7. A speed problem on one shared template used across all five offices is not a five-times-smaller problem than a single agency's. It is a five-times-larger one, because it is quietly taxing five ad budgets on the same architectural gap at once.
Worth a real conversation at this scale
Standardizing a fast landing page template across multiple offices, each keeping its own brand, is exactly the kind of work we handle for agencies running more than one site. Book a call.
Questions agencies ask
What is a normal cost per lead for an insurance agency running Google Ads in 2026?
WordStream's 2026 benchmark report puts the Finance and Insurance category at $74.44 per lead and $3.39 per click, drawn from 13,474 US search campaigns between April 2025 and March 2026. PPC Chief's own managed-account data lands close by at $83.93 per lead. Either figure is a starting point, not a guarantee. Your own number depends on your market, your keywords, and your landing page.
Does page speed actually affect what Google charges per click?
Google states plainly that Core Web Vitals performance aligns with what its core ranking systems reward, and a slow landing page experience is one of the signals Google Ads Quality Score weighs when it sets your actual cost per click. A low Quality Score does not just hurt organic search. It raises what you pay for the same ad position.
What is Largest Contentful Paint, and why does it matter on a page you are paying to send traffic to?
LCP measures how long it takes the largest visible element, usually a hero image or headline, to finish rendering. Google's published good threshold is 2.5 seconds or less, measured at the 75th percentile of visits and scored separately for mobile and desktop. On a paid click, every second before LCP is a second the visitor is looking at a blank or half-loaded page you already paid for.
Is a page-builder landing page automatically slower than a coded one?
Not automatically, but structurally it starts behind. A funnel builder or a WordPress page builder loads a JavaScript runtime, a theme, and often a stack of plugins before it assembles the page a visitor sees. A statically built page, the kind Astro produces, ships as finished HTML the browser can paint immediately. The gap is architectural, not a matter of who configured it better.
How do I check my own landing page's Core Web Vitals score right now?
Run the URL through Google's own PageSpeed Insights tool, free, no signup, and read the mobile score separately from the desktop score, since Google grades them on different simulated hardware. Look specifically at the LCP, INP, and CLS numbers rather than the single headline score, since that single score can hide a bad LCP behind decent numbers elsewhere.
Does this apply to Facebook and Meta ads too, or just Google Search?
The mechanism is the same on any paid channel. Meta does not publish a Quality Score the way Google does, but its ad auction includes an estimated action rate that reflects how likely a click is to convert, and a slow landing page lowers that estimate the same way a slow page lowers Google's Quality Score. You already paid for the click on both platforms before the page finishes loading.
What does Digital Foundation actually do about landing page speed?
It replaces the page-builder or WordPress stack with a site built on Astro, which ships zero JavaScript to the browser by default, so pages arrive as finished HTML rather than a runtime that assembles the page after it loads. Our builds score 90 or higher on Lighthouse performance for both mobile and desktop, and a number of pages score 100, verified live on the Digital Foundation pricing page.
Can I fix this myself without switching platforms?
Often, partially. Compressing hero images, removing unused tracking pixels and chat widgets, and trimming plugins will genuinely improve a WordPress or page-builder landing page's LCP. What a DIY fix usually cannot reach is the runtime the platform itself loads before your content, which is why the gains tend to plateau well short of what a static-HTML site starts at by default.
What exactly is landing page experience in Google's Quality Score, and can I see my own?
Google names it as one of three published Quality Score components, alongside expected click-through rate and ad relevance, and defines it as how relevant and useful your landing page is to people who click your ad. You can see a landing page experience rating of Below Average, Average, or Above Average for your own keywords inside the Google Ads interface, under the Quality Score columns.
If my cost per lead is already close to the $74 benchmark, is speed still worth fixing?
Yes, because the benchmark is an average, not a ceiling. An agency sitting at the category average today is still leaving the documented 8.9% to 33.13% conversion gains other companies captured from Core Web Vitals work on the table, at the exact same ad spend they are already committing every month.
Sources
- WordStream. "2026 Google Ads Benchmarks," Finance and Insurance category, 13,474 US search campaigns, April 2025 to March 2026, verified live 2026-08-06. wordstream.com.
- PPC Chief. "Google Ads Cost, Finance and Insurance," aggregated benchmark plus managed-account data, reviewed 2026-05-22, verified live 2026-08-06. ppcchief.com.
- Google Search Central. "Understanding Core Web Vitals and Google search results," ranking systems statement, verified live 2026-08-06. developers.google.com.
- web.dev. "Web Vitals," 75th percentile measurement methodology, segmented by mobile and desktop, verified live 2026-08-06. web.dev.
- web.dev. "LCP," "INP," and "CLS," published good, needs improvement, and poor threshold bands, verified live 2026-08-06. web.dev.
- web.dev. "How Nuvemshop's image prioritization strategy led to a 68% improvement in LCP and 8.9% more conversions," published 2026-06-24, measured January 2025 to January 2026 across 180,000+ stores, verified live 2026-08-06. web.dev.
- web.dev. "How Rakuten 24's investment in Core Web Vitals increased revenue per visitor by 53.37% and conversion rate by 33.13%," A/B test results, last updated 2022-08-24, verified live 2026-08-06. web.dev.
- Astro. "Why Astro," zero JavaScript by default, verified live 2026-08-06. docs.astro.build.
- Strategic AI Architects. "Digital Foundation," pricing and guarantee, verified live 2026-08-06. strategicaiarchitects.com.
- Google Ads Help. "Quality Score: definitions," expected CTR, ad relevance, and landing page experience components, verified live 2026-08-06. support.google.com.
Talk it through
Want a second pair of eyes on it?
Free 30 minutes. Bring what you found, or bring nothing and we will look together at how AI engines read your site and which fixes move first.
See what your landing page is actually costing you
Run the free Audit, a live AEO Audit plus a HIPAA tracking scan of your site, in under a minute.
Related reading: why insurance websites fail Google's speed test · what an agency website really costs