Playbook
Why Your Insurance Website Fails Google's Speed Test
Google runs two separate speed reports on your site, mobile and desktop, and the phone score is the one deciding whether a prospect ever sees your quote form.


19 min read
Google scores your site's speed on mobile and desktop separately, using different simulated hardware, and the three metrics it measures are used by its ranking systems1. A 0.1 second improvement in mobile speed raised lead form completions by 21.6% in Google's own study of 37 brand sites10, and 91% of Americans now carry a smartphone8 that gets judged by a stricter test than the laptop you probably used to check your own site. The fix is not a plugin. It is the difference between a site that sends a finished page and one that has to assemble itself inside the visitor's browser first.
Why it passes on your laptop
It passes because you almost certainly tested it on the wrong device: Google's speed tools check your site twice, once simulating a mid-range phone and once on hardware closer to your own laptop, and only the phone version is the one most of your prospects actually see. Here is the scenario, almost word for word, from a dozen agency owners we have talked to. You check your own website. It opens fast, the quote form loads, everything looks clean. Then a client mentions the site felt slow on their phone in the parking lot before an appointment, or you run it through a speed checker on a whim and the mobile number comes back in the 40s or 50s while desktop sits in the 90s. Nothing changed on the site between those two tests. What changed is which version of "your site" got tested.
This is not a rare glitch. It is the predictable result of testing a site on the one device that almost never struggles with it, your own workstation, instead of the one Google actually uses to decide how your site indexes and ranks. Since the shift to mobile-first indexing, Google's Search Central documentation states plainly that it "uses the mobile version of a site's content, crawled with the smartphone agent, for indexing and ranking"14. Your desktop experience is not the primary version anymore, in Google's own systems. The mobile rendering of your site is.
Google's own speed tooling does not test your site once. It tests it twice, once simulating a mid-range Android phone on a throttled connection, and once on hardware closer to what you are actually sitting in front of. Google's PageSpeed Insights documentation is specific about this: the lab test uses "predetermined network and CPU throttling settings" run against fixed device specifications, historically a Moto G4, in a Google data center, precisely so the test reflects a realistic phone rather than your Chrome browser on an office connection7. Your laptop, on your office wifi, is not a fair proxy for that test. It is closer to the desktop condition, which is the easier of the two.
Lab data versus field data
PageSpeed Insights actually shows you two different kinds of numbers. Lab data is that simulated Moto G4 test, run fresh each time you check, useful for debugging a specific page. Field data comes from the Chrome UX Report, real Chrome users who visited your actual site over the past 28 days, on whatever device and connection they really had7. Google's own documentation notes the two "may differ," and when they do, the field data is the one describing what real visitors experienced, not what a lab simulation predicted7.
There is a second reason the gap shows up specifically on mobile. Chrome UX Report, the dataset behind both PageSpeed Insights' field data and Search Console's Core Web Vitals report, requires a page to be "publicly discoverable" and "sufficiently popular" to be included at all, and it reports mobile and desktop as separate populations of real visits, not a blended average6. A site that is fine on desktop and weak on mobile is not an edge case in that data. It is one of the more common shapes a report takes, because the two platforms fail for different reasons: desktop machines are fast enough to absorb a lot of inefficiency, and phones are not.
What Core Web Vitals measure
Core Web Vitals is Google's name for three specific measurements, and Google's Search Central documentation states plainly that they "are used by our ranking systems," alongside other page experience signals1. None of the three is exotic once you see what each one is actually counting.
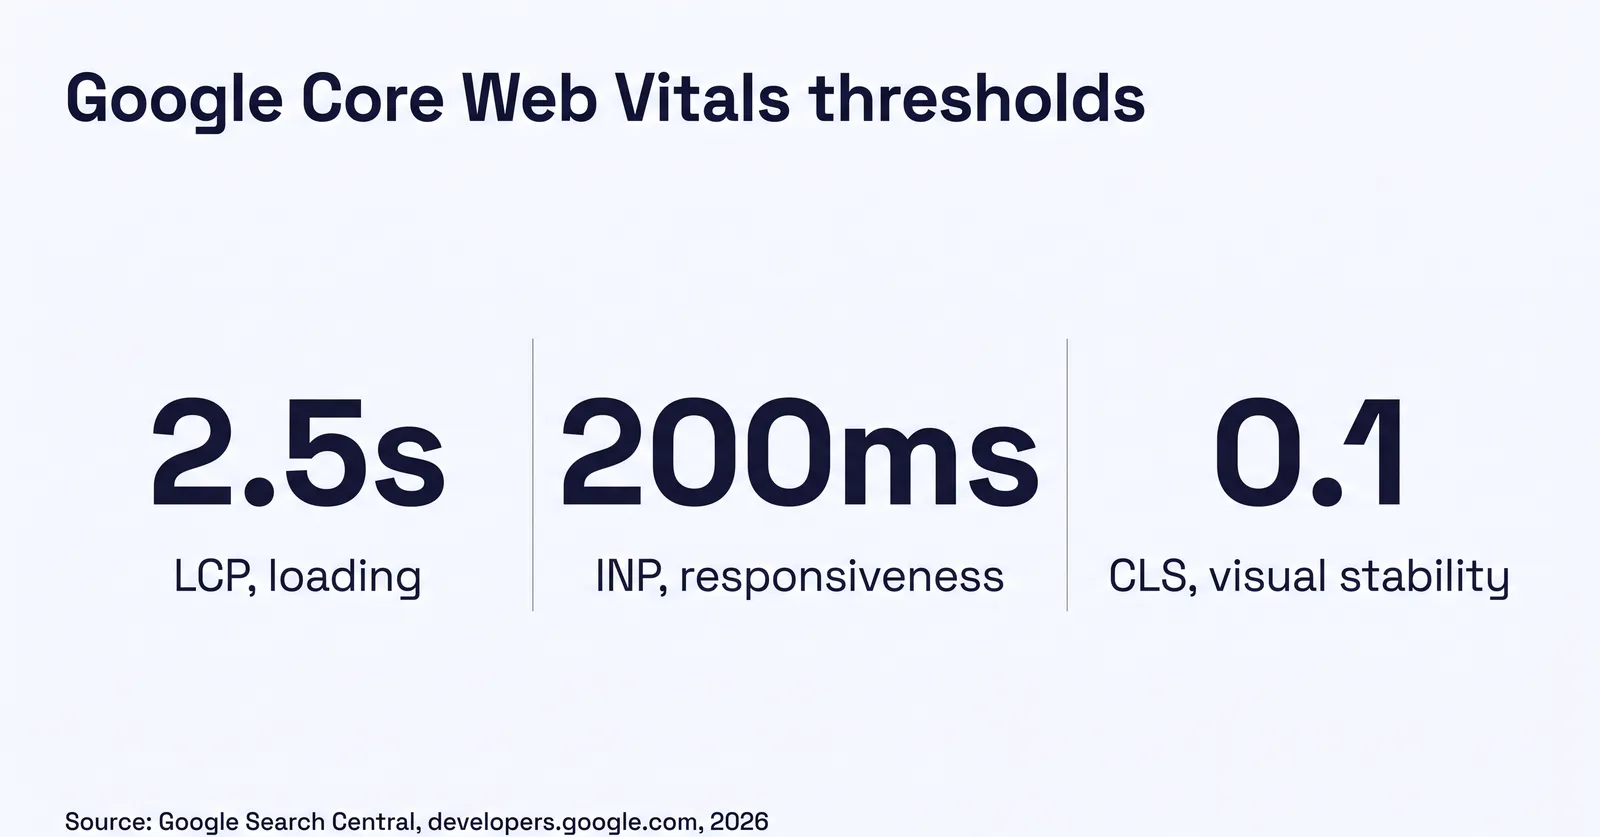
Largest Contentful Paint (LCP) is the time until the biggest visible element on the page, usually your hero image or headline, actually renders. It is loading speed, measured the way a visitor experiences it: not when the server responds, but when something worth looking at shows up. Interaction to Next Paint (INP) measures responsiveness across the entire visit: how long the page takes to visibly react every time someone taps a button, opens the mobile menu, or fills in a form field, not just on the first click1. Cumulative Layout Shift (CLS) measures visual stability, whether the page jumps around while it loads, which is the experience of trying to tap "Get a Quote" and hitting an ad or a different button because the layout moved under your thumb.
| Metric | Good | Needs improvement | Poor |
|---|---|---|---|
| LCP, loading | 2.5s or less | 2.5s to 4.0s | Over 4.0s3 |
| INP, responsiveness | 200ms or less | 200ms to 500ms | Over 500ms4 |
| CLS, visual stability | 0.1 or less | 0.1 to 0.25 | Over 0.255 |
Every one of those thresholds is measured "at the 75th percentile of page loads, segmented across mobile and desktop devices," per Google's own methodology6. That detail matters more than it sounds like it should. A 75th percentile threshold means three out of every four of your real visits need to hit that number, not your best case, not an average that a handful of fast visits can drag up. One good test on your own phone on wifi proves nothing about the other 75% of visits Google is actually grading.
Try this before the next section
Curious what your site scores on mobile? Run it through PageSpeed Insights before you read on. If the mobile number comes back under 90, the rest of this guide is worth your time. If it is already 90 or above on both mobile and desktop, most of what follows will simply confirm you built on the right foundation.
Why mobile is graded on its own
It is worth being precise about why Google bothers to split this at all instead of reporting one blended score. Search Console's Core Web Vitals report shows mobile and desktop as separate tables. PageSpeed Insights runs them as two separate tests you have to trigger independently. The Chrome UX Report, the real-user dataset behind both, segments every metric by device category because a phone on a cellular connection and a desktop on broadband are not comparable environments, and blending them would hide exactly the gap that matters most for a prospect standing in a parking lot with one bar of signal6.
Google is explicit that Core Web Vitals sit inside a broader page experience signal, and that "there is no single signal" deciding a ranking, since core ranking systems weigh a variety of factors alongside it2. Speed will not out-rank a page with thin, irrelevant content. What Google's documentation does say is that when two pages are otherwise close on relevance and quality, page experience "can contribute to success in Search"2. For an agency competing against three or four other local producers whose content covers similar ground, that tiebreaker condition is closer to the normal case than the exception.
And the tiebreaker only fires on the metric that actually reflects your real traffic mix. Pew Research's most recent mobile fact sheet, drawn from a survey of 5,022 U.S. adults run from February through June 2025, puts smartphone ownership at 91% of Americans8. A prospect comparing Medicare Advantage plans or an ACA subsidy estimate at ten o'clock at night is doing it from a phone far more often than from a desk. If your mobile score is the one nobody is watching, it is also the one deciding what the median prospect actually experiences.
It is worth naming the specific moment where this bites hardest for an insurance site: the quote or intake form. A brochure page that loads two seconds slower is annoying. A quote form that stutters while someone is entering a ZIP code and a birthdate, mid-thought, on a phone held in one hand, is the moment an agency actually loses the visitor it paid to acquire or waited months to earn organically. That page deserves its own speed check, not just the homepage, for exactly that reason.
Why page builder sites run slower
They run slower because the browser has to assemble the page after it arrives, instead of receiving a finished one. That difference is architectural, not a setting someone forgot to flip, and it is worth explaining plainly rather than waving at.
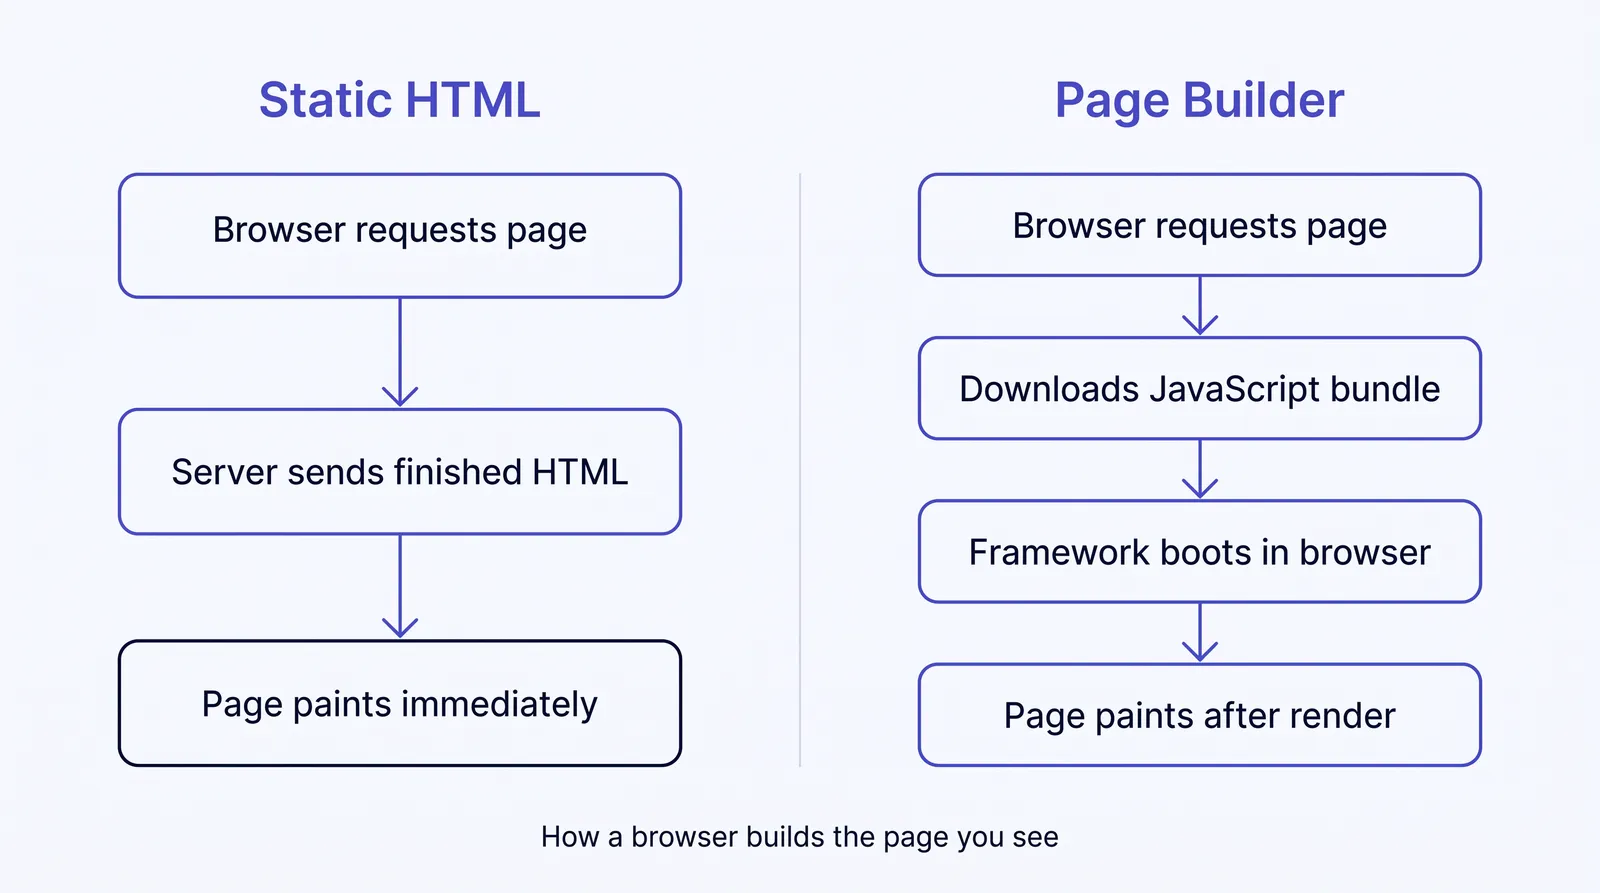
A static site, the kind we build on Astro, renders the page to finished HTML at build time. When a phone requests the page, the server hands back a complete document. The browser paints what it received. There is no framework to download and boot before the content shows up, because Astro ships zero JavaScript to the browser by default. A page builder like GoHighLevel or a WordPress site running a visual page builder works the other way around: the browser downloads a JavaScript bundle, boots a rendering framework, fetches the page's content and styling, and only then assembles and paints what the visitor sees. Every one of those extra steps costs time, and on a phone on a slower connection, the cost compounds instead of staying fixed.
You do not have to take our word for the weight of that default. GoHighLevel's own help documentation, last updated March 26, 2026, describes a recent internal optimization where the platform "removed unnecessary fields from the page data response," cutting "the average final HTML document size by about 10%" to improve load performance9. That same article recommends agency users limit animations and widgets, avoid stacking third party tracking scripts, and remove unused page sections to help their own pages load faster9. A platform does not publish that advice, or ship an internal optimization to shrink its own HTML output, unless the default weight was real enough to be worth fixing on their end too.
Page builder default
- Browser downloads a JavaScript bundle before anything shows
- A framework has to boot inside the visitor's browser
- Third party scripts and widgets stack up over time
- Speed depends on how disciplined every editor stays
- Fixing it means fighting the platform's own defaults
BaselineHeavier by design, before you add anything
Astro build
- Server sends a finished page, nothing to assemble
- Zero JavaScript shipped to the browser by default
- Served from the edge on Cloudflare, close to the visitor
- Nothing for an editor to accidentally slow down later
- Speed is a property of the architecture, not upkeep
BaselineFast by default, before anyone optimizes anything
There is a second, quieter cost to the page builder model that has nothing to do with the framework itself: who is allowed to touch the page. A drag and drop builder makes it easy for anyone on the team to add a testimonial carousel, a countdown banner, or a chat widget from the app marketplace, and each addition is a small, individually reasonable decision. Eighteen months later the homepage is carrying a dozen widgets nobody remembers approving, each one adding its own script to the load. A static site does not remove human judgment from the process, but it does mean every addition goes through a build step where its weight is visible before it ships, rather than accumulating silently inside a visual editor.
None of this means a page builder site is doomed to fail Core Web Vitals forever, and it is worth saying so plainly. GoHighLevel's own changelog shows real engineering work going into render-blocking CSS and initial payload size on their end. A disciplined editor who compresses every image, limits third party scripts, and keeps pages lean can get a page builder site into a respectable range. What that editor cannot do through settings alone is remove the JavaScript boot step the platform's architecture requires before the page paints. That is the ceiling, not the floor, and it is the reason two sites with equally careful content teams can land in very different places on a mobile test.
What slow mobile speed costs you
None of this is abstract once you put a number on it. Google commissioned 55 and Deloitte Digital to study mobile site speed across 37 leading brand sites, tracking over 30 million user sessions hour by hour across 30 days10. The headline finding: a 0.1 second improvement in mobile load time increased retail conversion rates by 8.4% and average order value by 9.2%10. The lead generation breakdown is the more relevant number for a quote form. Moving visitors from the homepage to the first step of a form improved by 5.5% for every 0.1 second gained, and completions from that first step through to a finished submission improved by 21.6%10. That is not traffic you would have to go acquire. It is the traffic you already have, converting at a higher rate because fewer people gave up waiting.
2.5s
Good LCP threshold for a phone visit3
91%
Of Americans now own a smartphone8
21.6%
More form completions per 0.1s faster mobile load10
27.2%
Of US searches end without a click, Q1 202511
The other cost is quieter and shows up before a visitor ever converts. Semrush's Q1 2025 State of Search data puts zero-click search traffic at 27.2% of US searches, up from 24.4% in March 202411, meaning a rising share of buyers never leave the search results page at all, and answer engines are doing more of the reading on a page instead of a human clicking through. Google's own crawl budget documentation is direct about how site speed factors into that reading: "If Google can load and render your pages faster, we might be able to read more content from your site"12. A slow, script-heavy page is not just losing human visitors to impatience. It is more expensive for the same crawlers feeding AI answers to process, at the exact moment that channel is taking a larger share of how buyers find an agent.
Put a small number on it so the lift feels concrete instead of abstract. Say your quote page gets 500 mobile visits in a typical month, and 120 of those visitors start filling out the form. At the study's measured 21.6% lift in completions per 0.1 second of mobile speed gained10, closing just one 0.1 second gap would be worth roughly 26 additional completed forms a month from that same traffic, no additional ad spend, no new content, nothing except the page responding faster than it did before. That is an illustration built from the study's measured rate applied to a round hypothetical visit count, not a promise about your specific site, since the actual lift depends on where your page starts and how your visitors behave. The direction of the effect is the part that is not in question.
If you want to know where your own site stands rather than estimate it, the free Audit scores this alongside your AI citation readiness in about a minute. Run the free Audit.
Check your own score in 5 minutes
You do not need to guess at any of this. Here is the actual check, in order.
The 5 minute self check
- Open PageSpeed Insights and enter your homepage URL.
- Read the mobile score first. It will load first and it is the harder test.
- Note whether LCP, INP, and CLS each land in good, needs improvement, or poor.
- Check the "Discover what your real users are experiencing" field data panel, not just the lab score, if it has enough traffic to show one.
- Repeat the test on your quote or intake page specifically, not just the homepage. It is usually the heavier page and the one that matters most.
- If you have Search Console access, open the Core Web Vitals report and compare the mobile and desktop tables side by side.
Do this on your phone's actual mobile data at some point too, not just wifi, since PageSpeed Insights simulates a connection but nothing replaces watching your own quote form load on a real cell signal. If you have never seen your site stall on a weak connection, you have not seen it the way a meaningful share of your prospects have.
Why your INP number might look better than it is
INP is the one metric a lab test genuinely struggles to measure. Google's own documentation is direct about it: "the resulting INP value for a page during lab testing will be dependent on what interactions are performed during the measurement period," and some lab tools "won't report a page's INP because they only observe the loading of a page without any interactions"4. A tool that never taps your mobile menu or your quote form fields cannot flag a slow response to either. Field data, pulled from real visitors actually using the page, is what Google's documentation recommends instead4, and it is the number Search Console's Core Web Vitals report is built on.
What you can fix, and what you can't
If you are running a page builder site today, you are not stuck, and it is worth being honest about what real work can and cannot buy you. None of the fixes below require touching code or switching platforms. They require the kind of housekeeping that gets skipped when a site has five years of accumulated widgets, funnels, and half-finished sections nobody has cleaned out since the agency was smaller.
Compress every image
GoHighLevel's own guidance is direct: don't upload a giant image and expect the system to resize it for you9.
Cut stacked scripts
Every chat widget, pixel, and analytics tag you add is one more thing the browser has to load before the page is usable.
Turn on native optimization
Enable the platform's built-in "optimize JavaScript" and image optimization settings, and use native forms over third party embeds9.
Remove unused sections
Fewer rows, columns, and widgets means less for the framework to assemble on every visit9.
Limit animations
Video backgrounds and heavy motion effects are common, popular, and expensive on a phone CPU9.
Know the ceiling
None of this removes the framework boot step the platform requires before the page paints. That part is architectural.
You can do all of this yourself, this week, without touching a line of code. Most agents who try it get a real improvement and a mobile score that moves from the 40s into the 60s or 70s. Some read this list, decide the DIY path is worth the afternoon, and stop there, and that is a perfectly reasonable place to land if your site is otherwise working for you. Others get that far, watch the score plateau below 90 no matter what they trim, and realize the remaining gap is the architecture itself, not a setting they haven't found yet.
How we build differently
This is the problem we build agency sites to avoid from the start rather than optimize around later. We build on Astro, which ships zero JavaScript to the browser by default, so a phone receives a finished page instead of a framework to boot. Every site we ship is served from the edge on Cloudflare, close to wherever the visitor actually is. That architecture is why our builds score 90 or above on Lighthouse performance for both mobile and desktop, and why a number of pages score 100.
The speed work is only half the build. Every site also ships with a sitemap.xml, an llms.txt, and a robots.txt that regenerate themselves the moment a new page or post goes live, with the full absolute URL, so nothing has to be remembered or hand maintained. The robots.txt is written to welcome every crawler, including the named AI crawlers, rather than quietly blocking the traffic that would cite you. Every page carries the schema stack an answer engine actually reads: Organization, Service, Article, FAQPage, and BreadcrumbList, matched to what is really on the page. If you want the fuller picture of what changed in how agencies get cited, we wrote about that separately in what actually moved in AI search this year.
We build this into every site we ship
If you would rather see it than keep reading about it, look at Digital Foundation, our done-for-you agency website tier. See Digital Foundation.
Digital Foundation starts at $247 a month for a complete, compliant website with AEO optimization, Google Business Profile management, and an AI chat widget. The Pro tier, $497 a month, adds a weekly blog post, a weekly location page, and a 24/7 AI receptionist. The Scale tier, $997 a month, moves the publishing cadence to one new blog post every business day. All three tiers include a 14-day free trial and month to month billing, live in days, no long term contract13.
| Tier | Price | What it adds |
|---|---|---|
| Starter | $247/mo | Complete AEO-optimized site, GBP management, AI chat widget |
| Pro | $497/mo | Plus weekly blog post, weekly location page, 24/7 AI receptionist |
| Scale | $997/mo | Plus daily blog cadence, 2 new location pages weekly |
What a fast foundation gets you
Put the pieces together and the payoff is concrete rather than theoretical. A phone visitor who lands on a page that paints in under 2.5 seconds and responds the instant they tap something is a visitor who is still there when your quote form asks for a ZIP code. If you run paid traffic, that same speed gain is the one Google's own research ties directly to more completed lead forms from the same ad spend10. And a site a crawler can read cheaply and quickly is a site more likely to be the one an AI answer actually cites when a prospect asks who handles Medicare enrollment in their county, rather than a competitor's slower page the crawler gave up on halfway through.
None of that is a guarantee of a ranking, a lead count, or a citation. It is the foundation those outcomes are built on, and it is the one part of the stack that is entirely within your control before you spend a dollar on ads or content.
It also compounds in a direction most agency owners do not think about until it happens to them: every new blog post, location page, or quoter you add sits on top of the same foundation. On a slow, script-heavy platform, each addition is one more thing competing for the same limited render budget in a visitor's browser. On a static site, each addition is just another finished page, no heavier to load than the one before it. The foundation is the part of this decision that gets more expensive to change the longer you wait, because there is more content sitting on top of it every month you publish.
Questions agencies ask
What is a good Lighthouse or PageSpeed score for an insurance agency website?
Aim for 90 or above on mobile performance, not just desktop, since mobile is the harder test and the one more of your traffic hits. A score in the 90s on both is achievable on a static site. A score in the 30s to 60s on mobile is common for page builder sites and is not a configuration mistake, it is closer to the platform's baseline.
Does Google really grade mobile and desktop separately?
Yes. Chrome UX Report data, PageSpeed Insights, and Search Console's Core Web Vitals report all segment results by mobile and desktop because real users hit each on different hardware and networks, and Google's own methodology documentation says thresholds are assessed at the 75th percentile of page loads, segmented across mobile and desktop devices.
Can I make my GoHighLevel or WordPress site pass Core Web Vitals?
You can improve it meaningfully: compress images, cut third party scripts, turn on the platform's built in optimization settings, and remove unused sections. What you cannot fully undo through settings is the underlying rendering model. A page builder that assembles the page in the visitor's browser is starting from a heavier baseline than a site that sends finished HTML, and that gap shows up most on mobile.
What is the difference between Lighthouse and PageSpeed Insights?
Lighthouse is the tool that runs the test. PageSpeed Insights is Google's website that runs Lighthouse against a simulated mid-range phone for the lab score, and also shows real-world field data pulled from the Chrome UX Report for actual visitors to your site over the past 28 days. The two numbers can disagree, and the field data is the one describing what your real visitors experienced.
Why does my site feel fast to me but fail the test?
You are almost certainly testing it on a desktop or a recent laptop over decent office internet, which is close to the easier condition. The mobile test simulates a mid-tier Android phone on a slower connection on purpose, because that is closer to the median real visitor, not the best available hardware.
Does page speed matter if I mostly get leads from paid ads?
It matters more, not less. You are paying for every visitor who lands on that page, and a slower page converts a smaller share of the traffic you already bought. Google's own study of 37 brand sites found that a 0.1 second improvement in mobile speed increased homepage to lead form completions by 5.5% and full form submissions by 21.6%, which is the same visitor pool, just fewer of them abandoning before they finish.
Will a fast site guarantee I show up in AI answers?
No, and be wary of anyone who says it will. Speed is one input among several, alongside structured data, sourced content, and crawlability. What a slow, script heavy page does do is make it more expensive for a crawler to process your site at all, which works against you rather than for you.
How long does it take to move to a static, Astro based site?
It depends on how much content and how many custom tools the current site carries, and it is worth scoping on a real call rather than guessing here. What we can say is that the rebuild itself is not the slow part of most agency migrations, mapping and rewriting the content usually is.
Sources
- Google Search Central. "Understanding Core Web Vitals and Google Search Results." developers.google.com.
- Google Search Central. "Understanding Page Experience in Google Search Results." developers.google.com.
- web.dev. "Largest Contentful Paint (LCP)." web.dev.
- web.dev. "Interaction to Next Paint (INP)." web.dev.
- web.dev. "Cumulative Layout Shift (CLS)." web.dev.
- Chrome for Developers. "Chrome UX Report (CrUX) Methodology." developer.chrome.com.
- Google for Developers. "About PageSpeed Insights." developers.google.com.
- Pew Research Center. "Demographics of Mobile Device Ownership and Adoption in the United States," survey of 5,022 U.S. adults, Feb. to June 2025. pewresearch.org.
- GoHighLevel Help Center. "How to Improve Funnel/Website Page Speed," last updated March 26, 2026. help.gohighlevel.com.
- web.dev. "Milliseconds Make Millions," case study commissioned by Google, conducted by 55 and Deloitte Digital. web.dev.
- Semrush. "Is Zero-Click Search Traffic Increasing?," citing State of Search Q1 2025. semrush.com.
- Google Search Central. "Large Site Owner's Guide to Managing Your Crawl Budget." developers.google.com.
- Strategic AI Architects. "Digital Foundation," pricing verified live on 2026-07-29. strategicaiarchitects.com.
- Google Search Central. "Mobile-First Indexing Best Practices." developers.google.com.
Talk it through
Want a second pair of eyes on it?
Free 30 minutes. Bring what you found, or bring nothing and we will look together at how AI engines read your site and which fixes move first.
See what your own site scores before a prospect finds out
Run the free Audit, a live AEO Audit plus a HIPAA tracking scan of your site, in under a minute.